Preparing data for COMETSC from Seurat
One of the major goals of many single cell RNA-seq analyses is to generate a set of markers genes that identify distinct cell types. Analysis suites likes Seurat and scanpy easily generate lists of differentialy expressed genes, and these genes are then used as markers for the clusters of cells. This approach works to an extent, but it is rare to find a single gene that uniquely identifies a cell type or subtype. Rather, combinations of two or more genes are needed to uniquely identify a group of cells. Finding those combination, however, can be challenging, and is usually done manually based on trial and error and previous knowledge about the biology.
COMETSC is a recently developed tool that solves the problem of selecting the most specific marker gene sets Delaney et al. (2019). It takes as inputs:
- Cluster labels
- Gene Count Matrix
- Dimensionality reduction coordinates (e.g. UMAP, tSNE)
- Gene List (optional but recommended)
The documentation is actually quite good, but it doesn’t exactly lay out how to get these input files and the software is very picky about formatting. I spent a good number of hours battling with formatting my inputs correctly.
I do most of my analysis in Seurat, so I’m working with a Seurat Object. It took me a while, but the following code works to extract the needed files to feed to COMETSC
Count Matrix
matrix_cometsc <- Seurat::GetAssayData(so) #gets the normalized count matrix

write.table(as.matrix(matrix_cometsc), file= "markers.txt", row.names=TRUE, col.names=TRUE, sep = "\t", quote = FALSE)
This produces a matrix that has cell names as columns and gene names as rows, without any extra quoting. But, it’s still not exactly what COMETSC needs. There is a sneaky tab character above the row names so that that the column names align correctly.
write.table does not put that \t in , and I wasn’t able to find an elegant solution. So I did it the brute way and just added the tab at the command line. The following code works.
You can see what I mean here if I show the \t characters (here ^I)
D1_TTCAGGATCAAGCCAT^ID1_GTGGAGATCTGCTTAT^ID1_GCACGGTCACTCAGAT^ID1_TATACCTGTCTTACTT^ID1_TATATCCAGAGCATCG
MIR1302-2HG^I0^I0.0766241526725224^I0^I0
FAM138A^I0^I0^I0^I0
OR4F5^I0^I0^I0^I0
AL627309.1^I0.103146952196364^I0.0766241526725224^I0.0823802232731239^I0.0918193591402592
AL627309.3^I0^I0^I0^I0
AL627309.2^I0^I0^I0^I0
AL627309.4^I0^I0^I0^I0
AL732372.1^I0^I0^I0^I0
Before that first D1_TTCAGGATCAAGCCAT (cell ID), there needs to be a tab.
So to get it there, I use the following command line code from inside R, creating a new file so that I can check the original if something goes wrong.
system("sed '1s/.*/\t&/' markers.txt > markers2.txt")The output now has a tab in the first column header:
^ID1_TTCAGGATCAAGCCAT^ID1_GTGGAGATCTGCTTAT^ID1_GCACGGTCACTCAGAT^ID1_TATACCTGTCTTACTT
MIR1302-2HG^I0^I0.0766241526725224^I0^I0
FAM138A^I0^I0^I0^I0
OR4F5^I0^I0^I0^I0
AL627309.1^I0.103146952196364^I0.0766241526725224^I0.0823802232731239^I0.0918193591402592
AL627309.3^I0^I0^I0^I0
AL627309.2^I0^I0^I0^I0
AL627309.4^I0^I0^I0^I0
AL732372.1^I0^I0^I0^I0
UMAP embeddings
Then, you need to get out the UMAP embeddings (if using UMAP). It’s more straightforward because you don’t need that extra tab character.
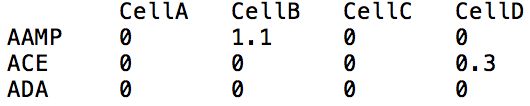
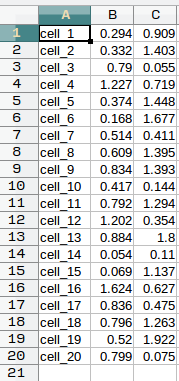
This is the desired output according to the docs.
umap_cometsc <- Embeddings(so, reduction = "umap")
write.table(umap_cometsc, file="vis.txt", row.names=TRUE, col.names=FALSE, sep = "\t", quote = FALSE)
Cluster IDs
colnames(so@meta.data)

cluster_cometsc <- noquote(as.matrix(Idents(so))) # Get the active cluster identities. Should be numbers. COMET does not take Non-Number cluster names.

write.table(cluster_cometsc, file = "clusters.txt"), row.names=TRUE, col.names=FALSE, sep = "\t", quote = FALSE)
Gene List
Lastly, you can extract a gene list. The documentation for COMETSC says it’s optional, but in reality it’s not, because when I ran COMETSC on my entire gene set (> 25,000), it collapsed and did not give any output.
The first author and developer recommends ~ 1000 genes
So I took the top 50 genes from my differential gene expression results and used those.
write.table(top50_markers_MAST_res1_pct25$gene, file = "genes.txt", col.names = F, row.names = F, quote = F)All together, that got me the input files and I was able to run the software. It was a bit harder than I expected, but part of that was due to my own knowledge gaps. It’s a promising tool that fills a big need, so I hope it gets use and I hope this post makes it easier for people using Seurat to get going.
If there are better or more elegant ways to get the input files out, please share your thoughts in the comments.
References
Delaney, Conor, Alexandra Schnell, Louis V Cammarata, Aaron Yao‐Smith, Aviv Regev, Vijay K Kuchroo, and Meromit Singer. 2019. “Combinatorial prediction of marker panels from single‐cell transcriptomic data.” Molecular Systems Biology 15 (10). https://doi.org/10.15252/msb.20199005.